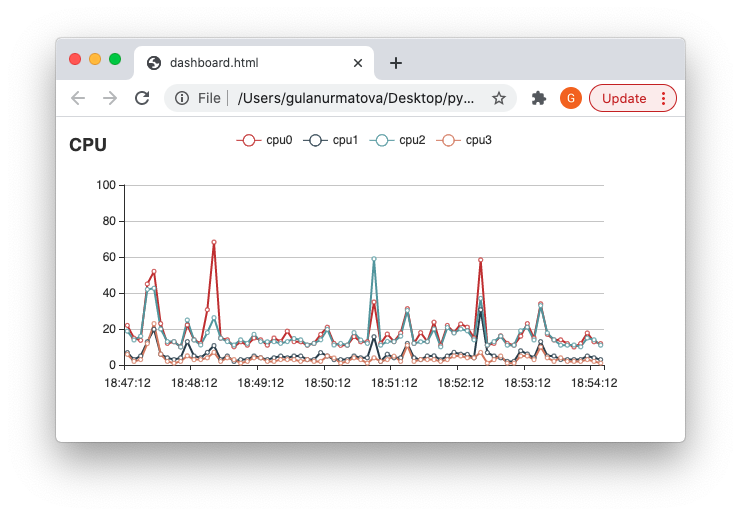
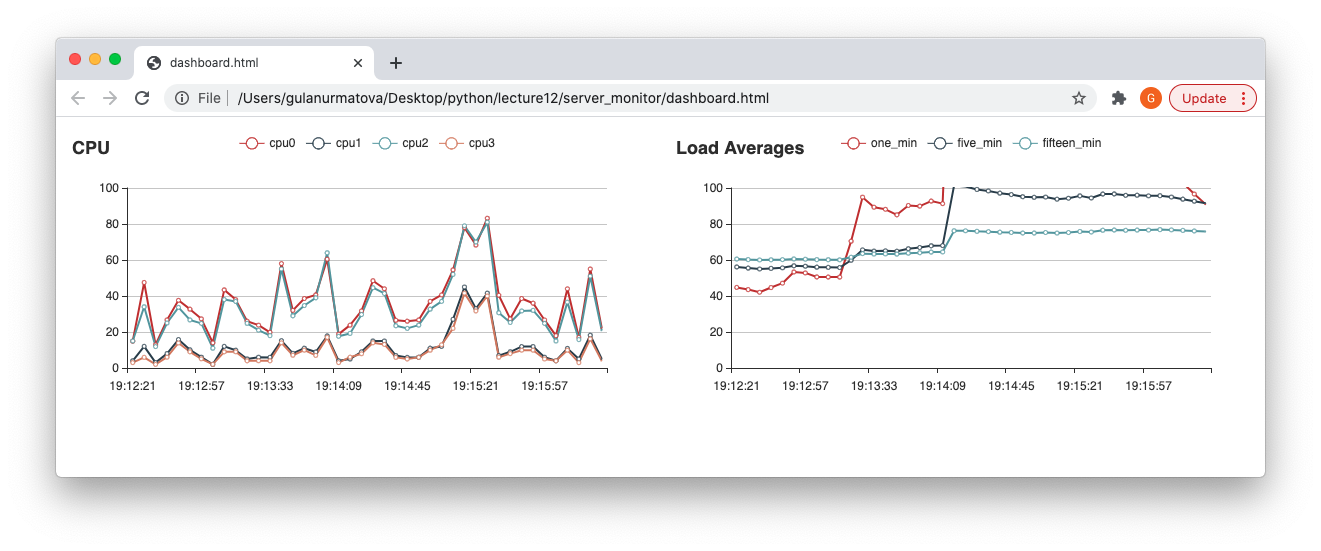
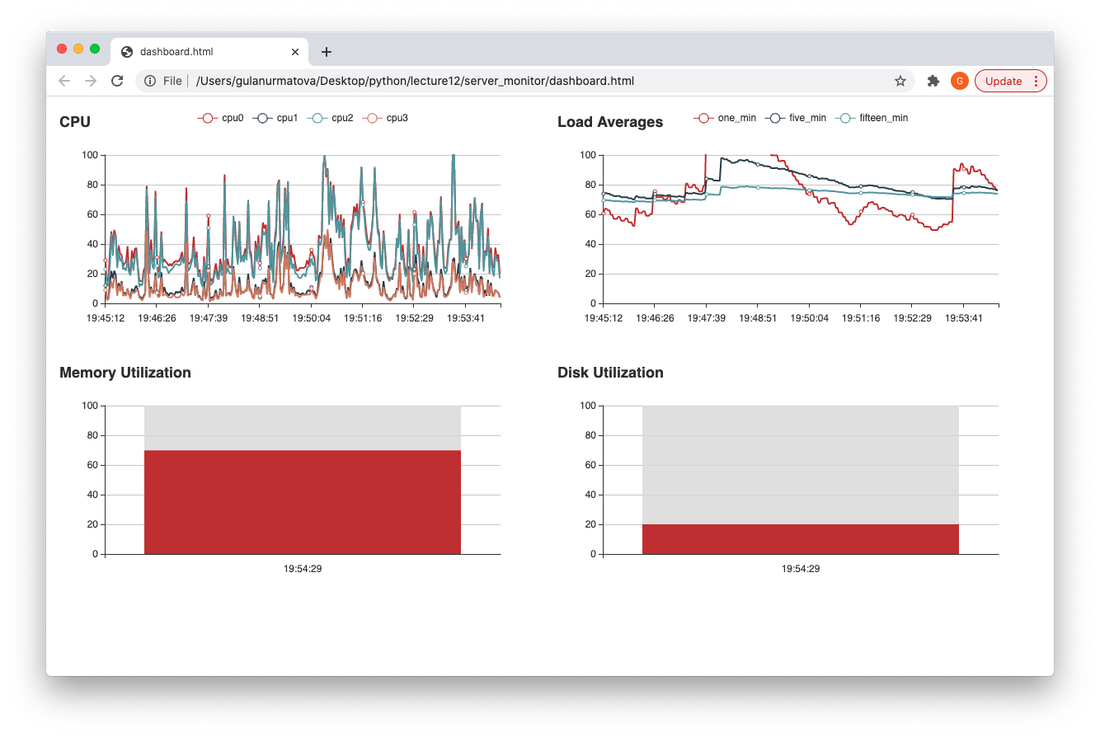
We are going to build a server monitoring dashboard using psutil, websockets and echarts
I am going to create a separate virtual environment for this excercise
I am going to create a separate virtual environment for this excercise
conda create --name iwebsockets python=3.8
and then
$ conda deactivate
$ conda activate iwebsockets
install websockets
$ pip install websockets
For System info we will use psutil
$ pip install psutil
We will plot following metrics:
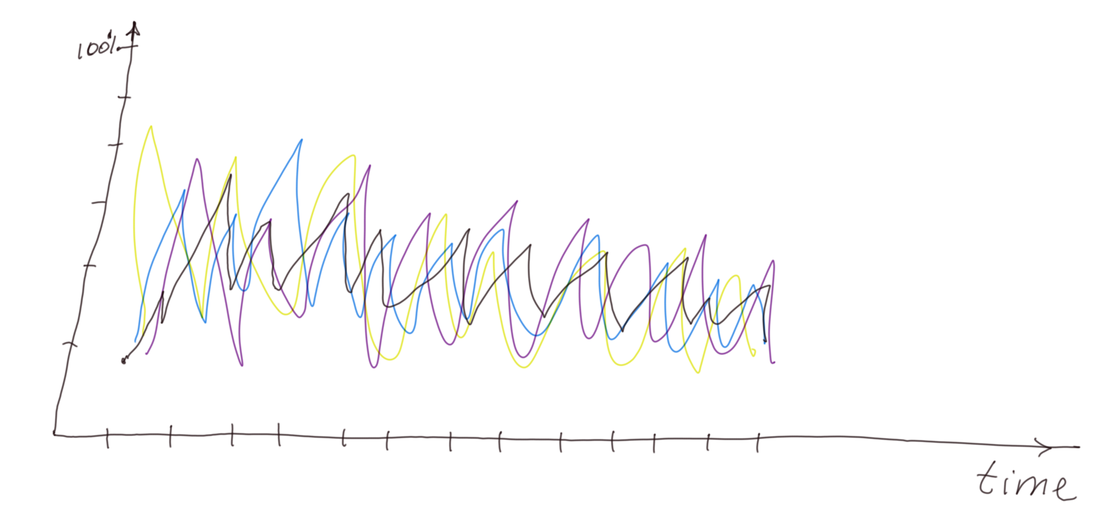
CPU Utilization:
there are 4 CPU's on my laptop and these are the percentages of the CPU Utilization
>>> import psutil
>>> psutil.cpu_percent(interval=1, percpu=True)
[31.0, 11.0, 29.7, 11.1]
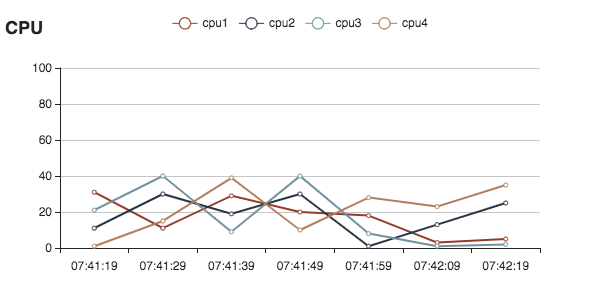
we can plot it in the form of 4 lines with time on x-axis and %utilization per CPU on the y-axis
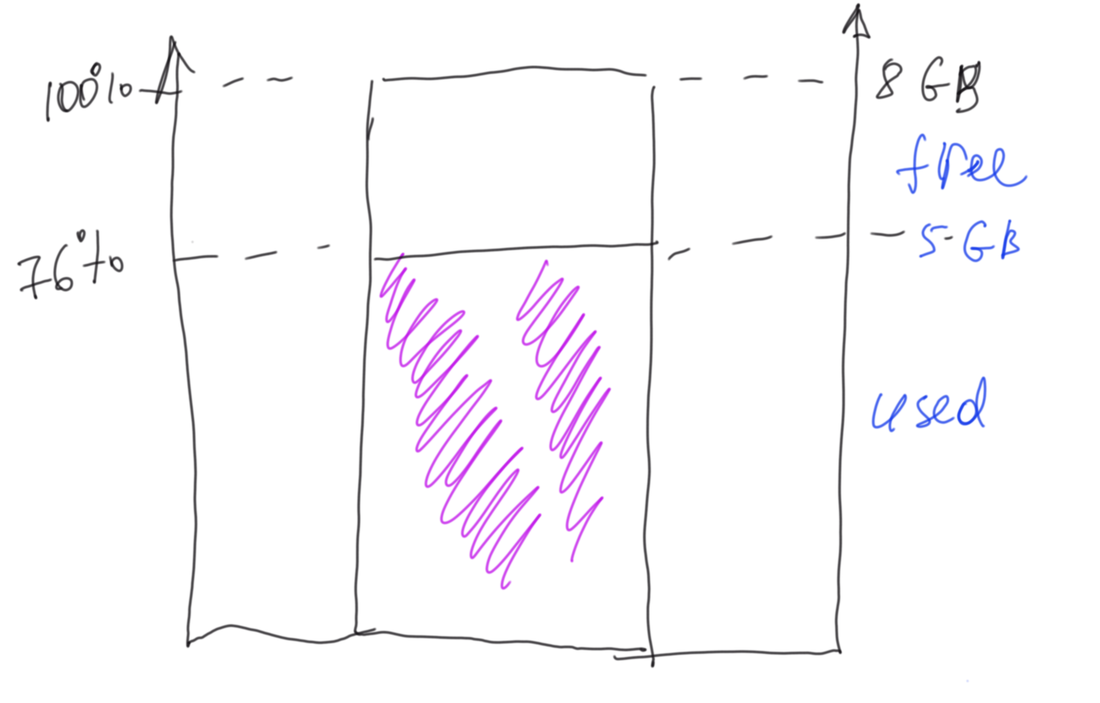
Memory in bytes:
>>> import psutil
>>> psutil.virtual_memory()
svmem(total=8589934592, available=2022039552, percent=76.5, used=5020946432, free=18976768, active=2008158208, inactive=2001862656, wired=3012788224)
We can plot it as a filled bar
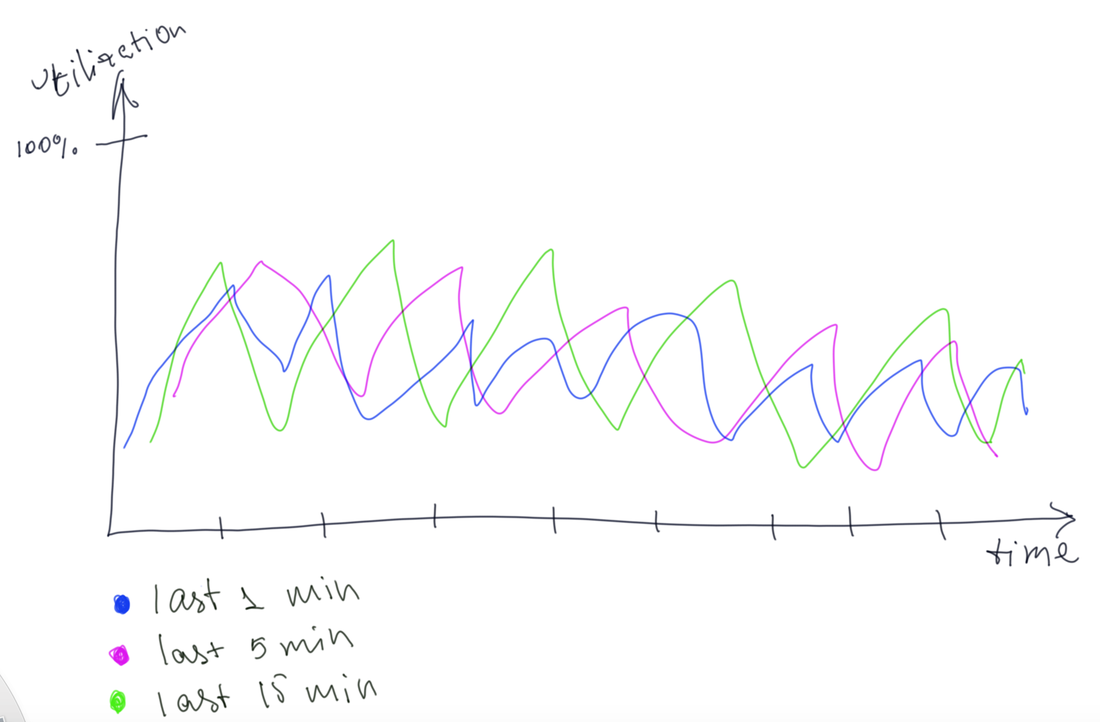
Load averages
>>> import psutil
>>> [x / psutil.cpu_count() * 100 for x in psutil.getloadavg()]
[66.357421875, 73.44970703125, 82.763671875]
the above formula provides the load averages in % representation. The 3 numbers are load averages for the last 1, 5 and 15 minutes
we can represent it as a line chart
Disk Usage
>>> import psutil
>>> psutil.disk_usage('/')
sdiskusage(total=250685575168, used=199632039936, free=43933831168, percent=82.0)
eCharts
eCharts is a JavaScript charting framework.
Download the echarts.js file
Download the echarts.js file
| echarts.js |
and place the dashboard.html in the same directory as the echarts.js file
dashboard.html
dashboard.html
<!DOCTYPE html>
<html>
<head>
    <script src="echarts.js"></script>
</head>
<body>
    <div id="cpu" style="width: 600px;height:300px;">
       <script>
        myChart = echarts.init(document.getElementById('cpu'));

        option = {
            legend:{
                data:["cpu1", "cpu2", "cpu3", "cpu4"]
            },
            title:{
                text:"CPU"
            },
            xAxis: {
                type: 'category',
                data: ['07:41:19', '07:41:29', '07:41:39', '07:41:49', '07:41:59', '07:42:09', '07:42:19']
            },
            yAxis: {
                type: 'value',
                min:0,
                max:100
            },
            series: [{
                name:"cpu1",
                data: [31, 11, 29, 20, 18, 3, 5],
                type: 'line',
            },
            {
                name:"cpu2",
                data: [11, 30, 19, 30, 1, 13, 25],
                type: 'line'
            },
            {
                name:"cpu3",
                data: [21, 40, 9, 40, 8, 1, 2],
                type: 'line'
            },
            {
                name:"cpu4",
                data: [1, 15, 39, 10, 28, 23, 35],
                type: 'line'
            }]
        };
        myChart.setOption(option);
    </script>
</body>
</html>
Please examine the JavaScript above, understand how it is plotted, we will now turn to building the CPU backend.
Based on the data we see above, we need to collect and format time as Hour:Minutes:Seconds and each of the CPU readings for the given time period.
We could build the entire chart structure on the back-end and send it to the front-end, but that's not the best way to do it, backend should only be concerned with providing the data and shouldn't care for the visual implementations, therefore, we will only send the data in following format:
{
"time":"07:41:09",
"cpu":{
"cpu1":31,
"cpu2":11,
"cpu3":21,
"cpu4":1
}
}
Note: in the examples above I am skipping date and only registering the time for simplicity, but in the real world, you would likely send entire timestamp in an epoch format and reformat it in the front end.
Out backend will need to infinitely scan the readings and stream them.
the program below will do the CPU readings and for the time being we are just printing them out:
import psutil
import time
from time import localtime, strftime
import json

def get_cpu_reading():
	cpu = {} #we will store the cpu readings here
	cpu_readings = psutil.cpu_percent(interval=1, percpu=True)

	for i in range(0,len(cpu_readings)):
		cpu['cpu'+str(i)] = cpu_readings[i]

	return cpu


while True:

	reading_time = strftime("%H:%M:%S", localtime())

	time.sleep(1)#sleep for 1 second

	send_obj = {"time":reading_time, "cpu":get_cpu_reading()}

	print(json.dumps(send_obj))
$ python system_reader.py
{"time": "15:03:38", "cpu": {"cpu0": 52.5, "cpu1": 33.0, "cpu2": 54.5, "cpu3": 35.0}}
{"time": "15:03:40", "cpu": {"cpu0": 58.0, "cpu1": 35.6, "cpu2": 54.5, "cpu3": 35.6}}
{"time": "15:03:42", "cpu": {"cpu0": 60.0, "cpu1": 41.0, "cpu2": 65.0, "cpu3": 41.0}}
{"time": "15:03:44", "cpu": {"cpu0": 48.0, "cpu1": 32.0, "cpu2": 48.5, "cpu3": 29.0}}
{"time": "15:03:46", "cpu": {"cpu0": 58.4, "cpu1": 37.0, "cpu2": 56.4, "cpu3": 37.0}}
{"time": "15:03:48", "cpu": {"cpu0": 52.5, "cpu1": 35.0, "cpu2": 52.9, "cpu3": 34.7}}
{"time": "15:03:50", "cpu": {"cpu0": 49.5, "cpu1": 32.3, "cpu2": 49.0, "cpu3": 32.0}}
{"time": "15:03:52", "cpu": {"cpu0": 54.0, "cpu1": 35.0, "cpu2": 55.4, "cpu3": 34.7}}
Let's try to send this data over the web sockets!
server.py:
import psutil
import time
from time import localtime, strftime
import json
import asyncio
import websockets

def get_cpu_reading():
	cpu = {} #we will store the cpu readings here
	cpu_readings = psutil.cpu_percent(interval=1, percpu=True)

	#{"cpu0": 52.5, "cpu1": 33.0, "cpu2": 54.5, "cpu3": 35.0}
	for i in range(0,len(cpu_readings)):
		cpu['cpu'+str(i)] = cpu_readings[i]

	return cpu


async def hello(websocket, path):
    name = await websocket.recv()
    time.sleep(1)#sleep for 1 second
    reading_time = strftime("%H:%M:%S", localtime())
    send_obj = json.dumps({"time":reading_time, "cpu":get_cpu_reading()})

    await websocket.send(send_obj)
    print(send_obj)

start_server = websockets.serve(hello, "localhost", 8765)

asyncio.get_event_loop().run_until_complete(start_server)
asyncio.get_event_loop().run_forever()
and to test the connection we will write a python client:
import asyncio
import websockets

async def hello():
    uri = "ws://localhost:8765"
    async with websockets.connect(uri) as websocket:
        await websocket.send("")
        msg = await websocket.recv()
        print(msg)

while True:
	asyncio.get_event_loop().run_until_complete(hello())
Run both from different terminal windows (run the server first) and you should see CPU readings both windows
$ python tread.py
{"time": "15:36:32", "cpu": {"cpu0": 52.5, "cpu1": 29.0, "cpu2": 50.0, "cpu3": 30.3}}
{"time": "15:36:34", "cpu": {"cpu0": 54.0, "cpu1": 33.0, "cpu2": 52.5, "cpu3": 32.0}}
{"time": "15:36:36", "cpu": {"cpu0": 45.5, "cpu1": 24.2, "cpu2": 48.0, "cpu3": 23.2}}
{"time": "15:36:38", "cpu": {"cpu0": 57.4, "cpu1": 34.0, "cpu2": 53.5, "cpu3": 34.7}}
{"time": "15:36:40", "cpu": {"cpu0": 52.0, "cpu1": 29.0, "cpu2": 49.5, "cpu3": 29.7}}
{"time": "15:36:42", "cpu": {"cpu0": 38.4, "cpu1": 20.0, "cpu2": 33.0, "cpu3": 19.0}}
{"time": "15:36:44", "cpu": {"cpu0": 56.4, "cpu1": 34.0, "cpu2": 56.0, "cpu3": 32.7}}
{"time": "15:36:46", "cpu": {"cpu0": 51.0, "cpu1": 30.7, "cpu2": 50.5, "cpu3": 30.0}}
{"time": "15:36:48", "cpu": {"cpu0": 58.0, "cpu1": 33.3, "cpu2": 53.0, "cpu3": 33.7}}
{"time": "15:36:50", "cpu": {"cpu0": 54.5, "cpu1": 35.4, "cpu2": 54.0, "cpu3": 35.4}}
let's connect the Javascript to the same websockets now
<!DOCTYPE html>
<html>
<head>
    <script src="echarts.js"></script>
    <script type="text/javascript">
        let received_data = null;
    </script>
</head>
<body>
    <div id="cpu" style="width: 600px;height:300px;">
       <script>


        CPUChart = echarts.init(document.getElementById('cpu'));

        cpu_chart = {
            legend:{
                data:[]
            },
            title:{
                text:"CPU"
            },
            xAxis: {
                type: 'category',
                data: []
            },
            yAxis: {
                type: 'value',
                min:0,
                max:100
            },
            series: []
        };


        function populateData(received_data){
            if(received_data == null){return;}
            cpu_chart.xAxis.data.push(received_data["time"]);
            series_created = false
            if(cpu_chart.series.length > 0){
                series_created = true
            }
            for (const [key, value] of Object.entries(received_data["cpu"])) {
                if(!series_created){
                    temp_obj = {'name':key, 'type': 'line', 'data':[value]};
                    cpu_chart.series.push(temp_obj);
                }
                else{
                    for(i = 0; i < cpu_chart.series.length; ++i){
                        if(cpu_chart.series[i]["name"] == key){
                            cpu_chart.series[i].data.push(value);
                            break;
                        }
                    }
                }


            }
            CPUChart.setOption(cpu_chart);
        }

        window.setInterval(function () {
            socket = new WebSocket("ws://localhost:8765");
            socket.onmessage = function(event) {
              populateData(JSON.parse(event.data));
            };
            socket.onopen = function(event){
                socket.send("");
            }
        }, 6000);
    </script>

</body>
</html>
| sys_monitor.zip |
We can now move onto building next metrics.
We will do load averages next, since those are a line chart as well
We add lines 18-21 and 28-30 to include the load averages
We will do load averages next, since those are a line chart as well
We add lines 18-21 and 28-30 to include the load averages
1 2 3 4 5 6 7 8 9 10 11 12 13 14 15 16 17 18 19 20 21 22 23 24 25 26 27 28 29 30 31 32 33 34 35 36 37 38 | import psutil import time from time import localtime, strftime import json import asyncio import websockets def get_cpu_reading(): cpu = {} #we will store the cpu readings here cpu_readings = psutil.cpu_percent(interval=1, percpu=True) #{"cpu0": 52.5, "cpu1": 33.0, "cpu2": 54.5, "cpu3": 35.0} for i in range(0,len(cpu_readings)): cpu['cpu'+str(i)] = cpu_readings[i] return cpu def get_load_averages(): load_avg = [x / psutil.cpu_count() * 100 for x in psutil.getloadavg()] mapped_avg = {"one_min":load_avg[0], "five_min":load_avg[1], "fifteen_min":load_avg[2]} return mapped_avg async def hello(websocket, path): name = await websocket.recv() time.sleep(1)#sleep for 1 second reading_time = strftime("%H:%M:%S", localtime()) send_obj = json.dumps({"time":reading_time,\ "cpu":get_cpu_reading(),\ "load_avg":get_load_averages()}) await websocket.send(send_obj) print(send_obj) start_server = websockets.serve(hello, "localhost", 8765) asyncio.get_event_loop().run_until_complete(start_server) asyncio.get_event_loop().run_forever() |
and we adjust the dashboard.html accordingly as well:
<!DOCTYPE html>
<html>
<head>
    <script src="echarts.js"></script>
    <script type="text/javascript">
        let received_data = null;
    </script>
</head>
<body>
    <table>
        <tr>
            <td>
                <div id="cpu" style="width: 600px;height:300px;">
            </td>
            <td>
                <div id="load" style="width: 600px;height:300px;">
            </td>
        </tr>
    </table>
       <script>


        CPUChart = echarts.init(document.getElementById('cpu'));

        cpu_chart = {
            legend:{
                show:true,
                data:[]
            },
            title:{
                text:"CPU"
            },
            xAxis: {
                type: 'category',
                data: []
            },
            yAxis: {
                type: 'value',
                min:0,
                max:100
            },
            series: []
        };

        LoadChart = echarts.init(document.getElementById('load'));

        load_chart = {
            legend:{
                show:true,
                data:[]
            },
            title:{
                text:"Load Averages"
            },
            xAxis: {
                type: 'category',
                data: []
            },
            yAxis: {
                type: 'value',
                min:0,
                max:100
            },
            series: []
        };


        function populateData(received_data){
            if(received_data == null){return;}
            cpu_chart.xAxis.data.push(received_data["time"]);
            series_created = false
            if(cpu_chart.series.length > 0){
                series_created = true
            }
            for (const [key, value] of Object.entries(received_data["cpu"])) {
                if(!series_created){
                    temp_obj = {'name':key, 'type': 'line', 'data':[value]};
                    cpu_chart.series.push(temp_obj);
                    new_val = key;
                    cpu_chart.legend.data.push(new_val);
                }
                else{
                    for(i = 0; i < cpu_chart.series.length; ++i){
                        if(cpu_chart.series[i]["name"] == key){
                            cpu_chart.series[i].data.push(value);
                            break;
                        }
                    }
                }
            }
            CPUChart.setOption(cpu_chart);

            load_chart.xAxis.data.push(received_data["time"]);
            series_created = false
            if(load_chart.series.length > 0){
                series_created = true
            }
            for (const [key, value] of Object.entries(received_data["load_avg"])) {
                if(!series_created){
                    temp_obj = {'name':key, 'type': 'line', 'data':[value]};
                    load_chart.series.push(temp_obj);
                    new_val = key;
                    load_chart.legend.data.push(new_val);
                }
                else{
                    for(i = 0; i < load_chart.series.length; ++i){
                        if(load_chart.series[i]["name"] == key){
                            load_chart.series[i].data.push(value);
                            break;
                        }
                    }
                }
            }
            LoadChart.setOption(load_chart);
        }

        window.setInterval(function () {
            socket = new WebSocket("ws://localhost:8765");
            socket.onmessage = function(event) {
              populateData(JSON.parse(event.data));
            };
            socket.onopen = function(event){
                socket.send("");
            }
        }, 6000);
    </script>

</body>
</html>
| server_monitor.zip |
We add two last charts:
1 2 3 4 5 6 7 8 9 10 11 12 13 14 15 16 17 18 19 20 21 22 23 24 25 26 27 28 29 30 31 32 33 34 35 36 37 38 39 40 41 42 43 44 45 46 47 48 | import psutil import time from time import localtime, strftime import json import asyncio import websockets def get_cpu_reading(): cpu = {} #we will store the cpu readings here cpu_readings = psutil.cpu_percent(interval=1, percpu=True) #{"cpu0": 52.5, "cpu1": 33.0, "cpu2": 54.5, "cpu3": 35.0} for i in range(0,len(cpu_readings)): cpu['cpu'+str(i)] = cpu_readings[i] return cpu def get_load_averages(): load_avg = [x / psutil.cpu_count() * 100 for x in psutil.getloadavg()] mapped_avg = {"one_min":load_avg[0], "five_min":load_avg[1], "fifteen_min":load_avg[2]} return mapped_avg def get_memory(): mem = psutil.virtual_memory() return mem[2] def get_disk(): disk = psutil.disk_usage('/') return disk[3] async def hello(websocket, path): name = await websocket.recv() time.sleep(1)#sleep for 1 second reading_time = strftime("%H:%M:%S", localtime()) send_obj = json.dumps({"time":reading_time,\ "cpu":get_cpu_reading(),\ "load_avg":get_load_averages(),\ "virtual_memory_utilized":get_memory(),\ "disk_utilized":get_disk()\ }) await websocket.send(send_obj) print(send_obj) start_server = websockets.serve(hello, "localhost", 8765) asyncio.get_event_loop().run_until_complete(start_server) asyncio.get_event_loop().run_forever() |
dashboard.html
<!DOCTYPE html>
<html>
<head>
    <script src="echarts.js"></script>
    <script type="text/javascript">
        let received_data = null;
    </script>
</head>
<body>
    <table>
        <tr>
            <td>
                <div id="cpu" style="width: 600px;height:300px;">
            </td>
            <td>
                <div id="load" style="width: 600px;height:300px;">
            </td>
        </tr>
        <tr>
            <td>
                <div id="memory" style="width: 600px;height:300px;">
            </td>
            <td>
                <div id="disk" style="width: 600px;height:300px;">
            </td>
        </tr>
    </table>
       <script>


        CPUChart = echarts.init(document.getElementById('cpu'));

        cpu_chart = {
            legend:{
                show:true,
                data:[]
            },
            title:{
                text:"CPU"
            },
            xAxis: {
                type: 'category',
                data: []
            },
            yAxis: {
                type: 'value',
                min:0,
                max:100
            },
            series: []
        };

        LoadChart = echarts.init(document.getElementById('load'));

        load_chart = {
            legend:{
                show:true,
                data:[]
            },
            title:{
                text:"Load Averages"
            },
            xAxis: {
                type: 'category',
                data: []
            },
            yAxis: {
                type: 'value',
                min:0,
                max:100
            },
            series: []
        };


        MemoryChart = echarts.init(document.getElementById('memory'));
        memory_chart = {
            title:{
                text:"Memory Utilization"
            },
            xAxis: {
                type: 'category',
                data: []
            },
            yAxis: {
                min:0,
                max:100,
                type: 'value'
            },
            series: [{
                data: [],
                type: 'bar',
                showBackground: true,
                backgroundStyle: {
                    color: 'rgba(220, 220, 220, 0.8)'
                }
            }]
        };

        DiskChart = echarts.init(document.getElementById('disk'));
        disk_chart = {
            title:{
                text:"Disk Utilization"
            },
            xAxis: {
                type: 'category',
                data: []
            },
            yAxis: {
                min:0,
                max:100,
                type: 'value'
            },
            series: [{
                data: [],
                type: 'bar',
                showBackground: true,
                backgroundStyle: {
                    color: 'rgba(220, 220, 220, 0.8)'
                }
            }]
        };

        function populateData(received_data){
            if(received_data == null){return;}

            if(disk_chart.xAxis.data.length == 0){
                disk_chart.xAxis.data.push(received_data["time"]);
                disk_chart.series[0].data.push(received_data["disk_utilized"]);
            }
            else{
                disk_chart.xAxis.data[0] = received_data["time"];
                disk_chart.series[0].data[0] = received_data["disk_utilized"];
            }

            DiskChart.setOption(disk_chart);

            if(memory_chart.xAxis.data.length == 0){
                memory_chart.xAxis.data.push(received_data["time"]);
                memory_chart.series[0].data.push(received_data["virtual_memory_utilized"]);
            }
            else{
                memory_chart.xAxis.data[0] = received_data["time"];
                memory_chart.series[0].data[0] = received_data["virtual_memory_utilized"];
            }

            MemoryChart.setOption(memory_chart);

            cpu_chart.xAxis.data.push(received_data["time"]);
            series_created = false
            if(cpu_chart.series.length > 0){
                series_created = true
            }
            for (const [key, value] of Object.entries(received_data["cpu"])) {
                if(!series_created){
                    temp_obj = {'name':key, 'type': 'line', 'data':[value]};
                    cpu_chart.series.push(temp_obj);
                    new_val = key;
                    cpu_chart.legend.data.push(new_val);
                }
                else{
                    for(i = 0; i < cpu_chart.series.length; ++i){
                        if(cpu_chart.series[i]["name"] == key){
                            cpu_chart.series[i].data.push(value);
                            break;
                        }
                    }
                }
            }
            CPUChart.setOption(cpu_chart);

            load_chart.xAxis.data.push(received_data["time"]);
            series_created = false
            if(load_chart.series.length > 0){
                series_created = true
            }
            for (const [key, value] of Object.entries(received_data["load_avg"])) {
                if(!series_created){
                    temp_obj = {'name':key, 'type': 'line', 'data':[value]};
                    load_chart.series.push(temp_obj);
                    new_val = key;
                    load_chart.legend.data.push(new_val);
                }
                else{
                    for(i = 0; i < load_chart.series.length; ++i){
                        if(load_chart.series[i]["name"] == key){
                            load_chart.series[i].data.push(value);
                            break;
                        }
                    }
                }
            }
            LoadChart.setOption(load_chart);
        }

        window.setInterval(function () {
            socket = new WebSocket("ws://localhost:8765");
            socket.onmessage = function(event) {
              populateData(JSON.parse(event.data));
            };
            socket.onopen = function(event){
                socket.send("");
            }
        }, 1000);
    </script>

</body>
</html>
| server_monitor.zip |
