Jupyter Notebooks
Jupyter Notebook is a server that can run on your local machine or a remote server.
It's a visual editor for the code that you are writing, it is often used by data analysts and data scientists to explain what their code is doing
It's a visual editor for the code that you are writing, it is often used by data analysts and data scientists to explain what their code is doing
Download following file:
| notebook_intro.ipynb |
It may be best to place it in a new dedicated folder and then run following command from inside that folder:
$ jupyter notebook
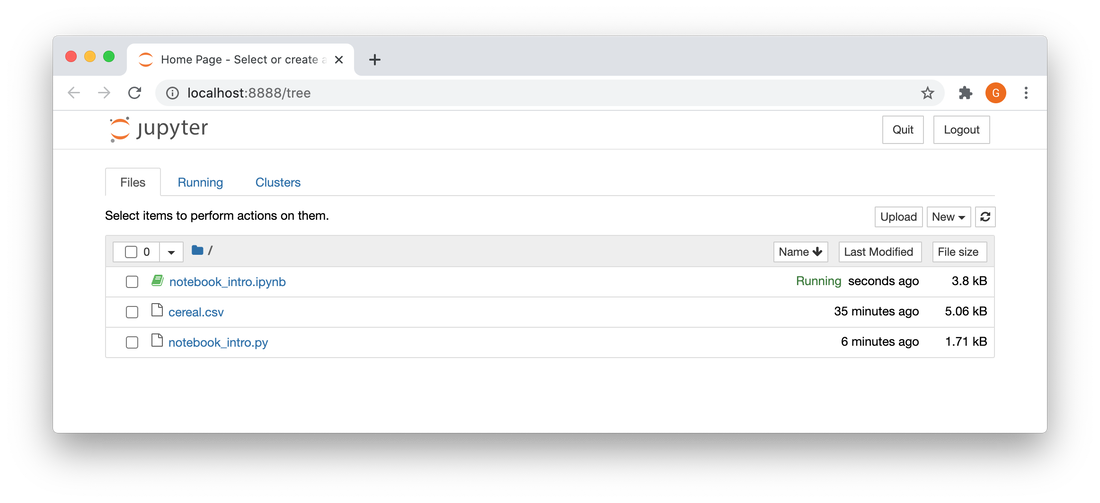
You should have the jupyter installed as part of your conda installation, hence you shouldn't see any errors and that command would launch a server with an initial screen containing directory listing, you would have only the .ipynb file:
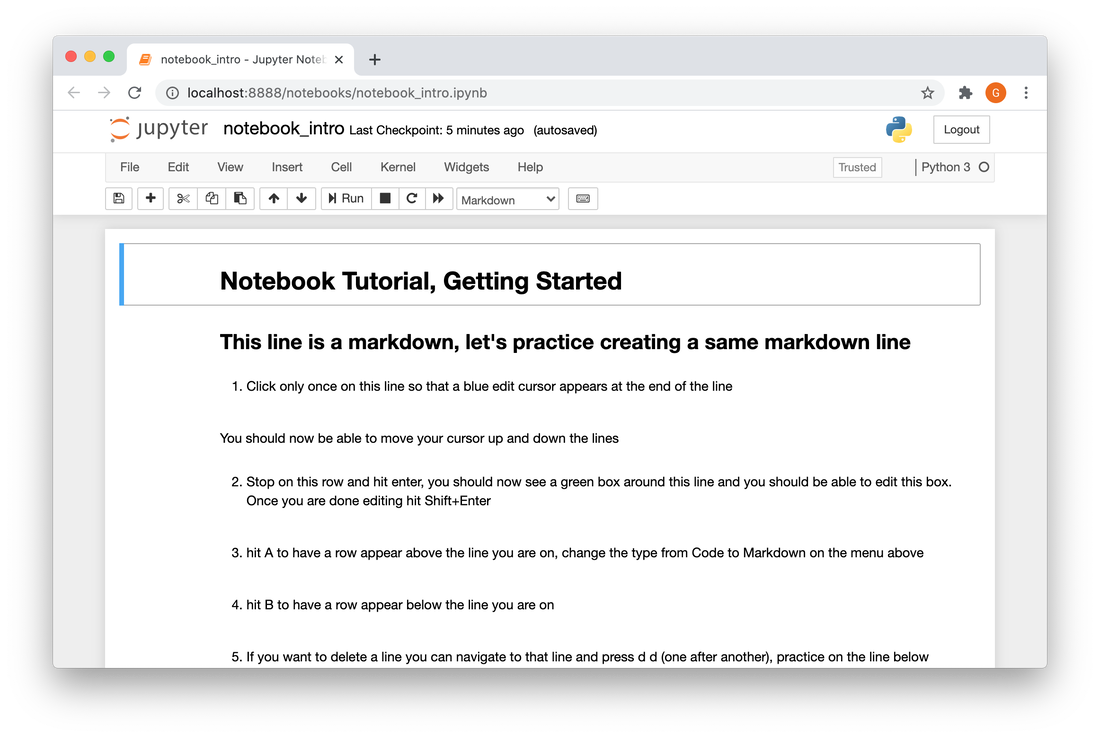
click on the ipynb file and follow the tutorial, this is what you should be seeing:
Analyzing Data in Jupyter Notebook
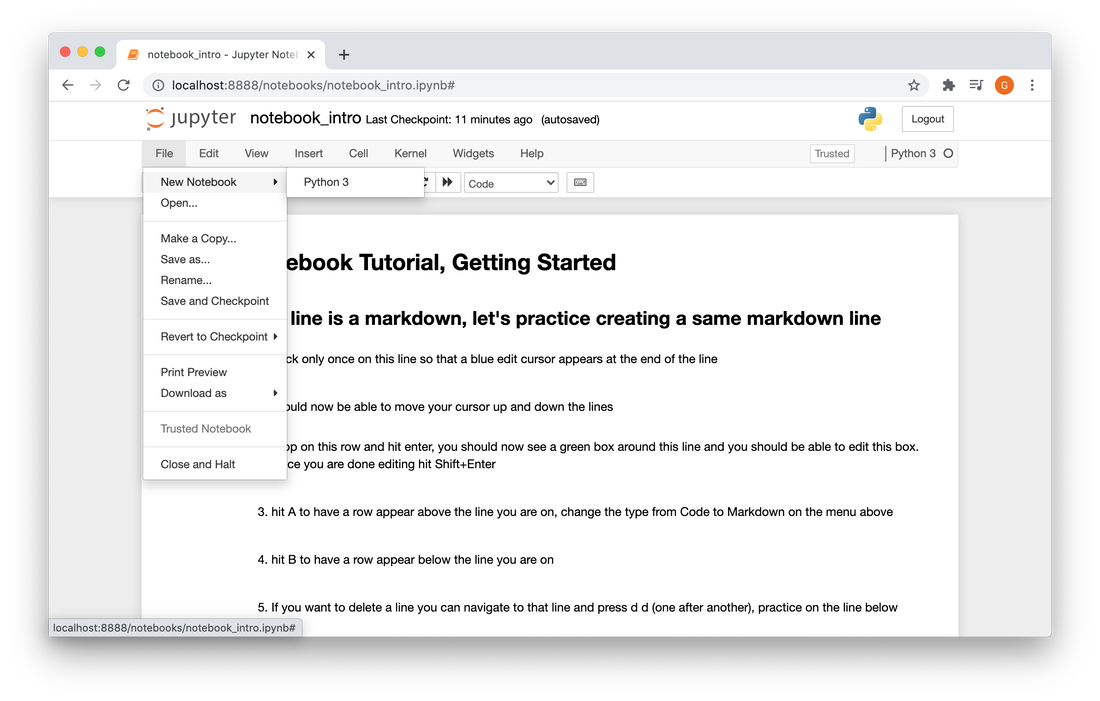
We will create a new Notebook, go to File -> New Notebook -> Python 3
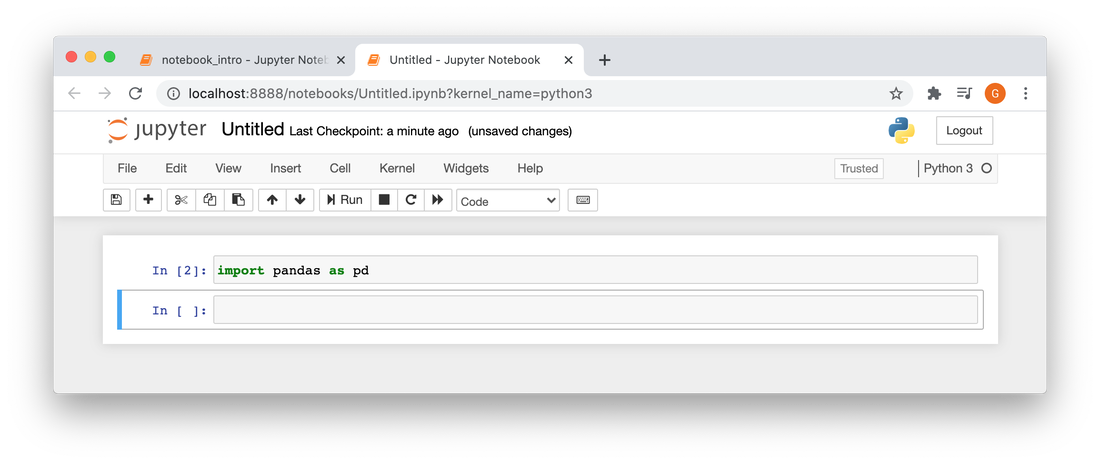
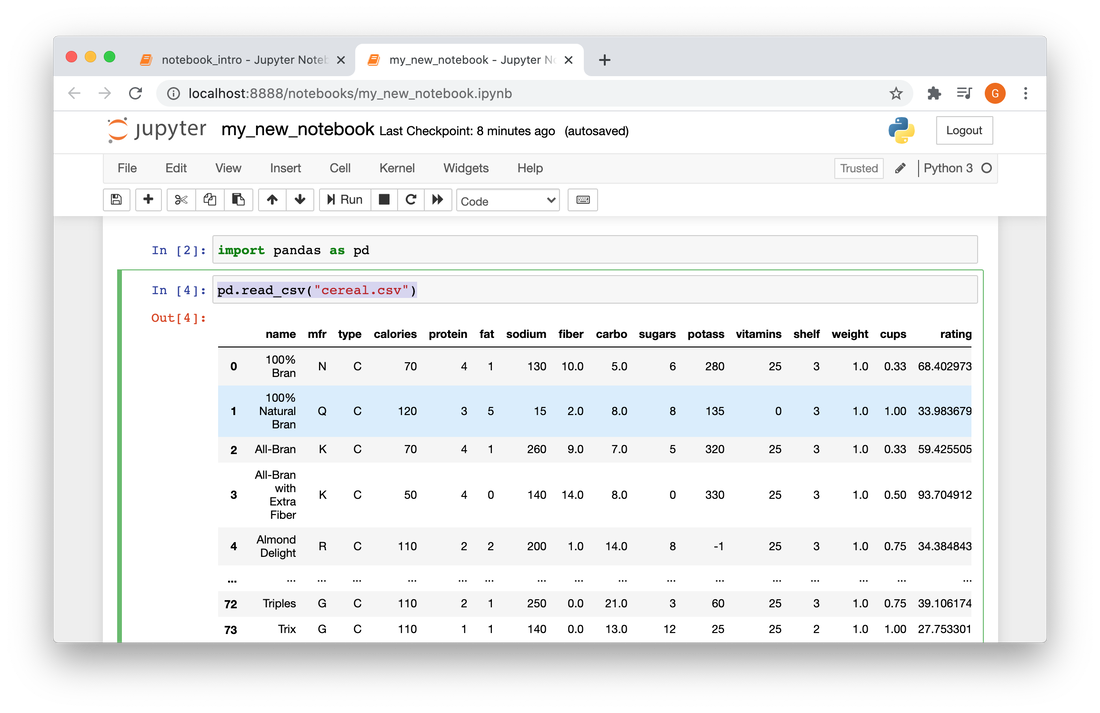
Import pandas, like in the image below and go to Faile -> Save As -> give it some creative name
Download following file and place it in the same folder where your notebook file is located:
| cereal.csv |
Now, we can open the file using pandas:
pd.read_csv("cereal.csv")
This is approximately what that should look like:
add data = before the read from csv so that we have a handler for our data.
the type of this object is pandas data frame, which is similar to dictionary/JSON
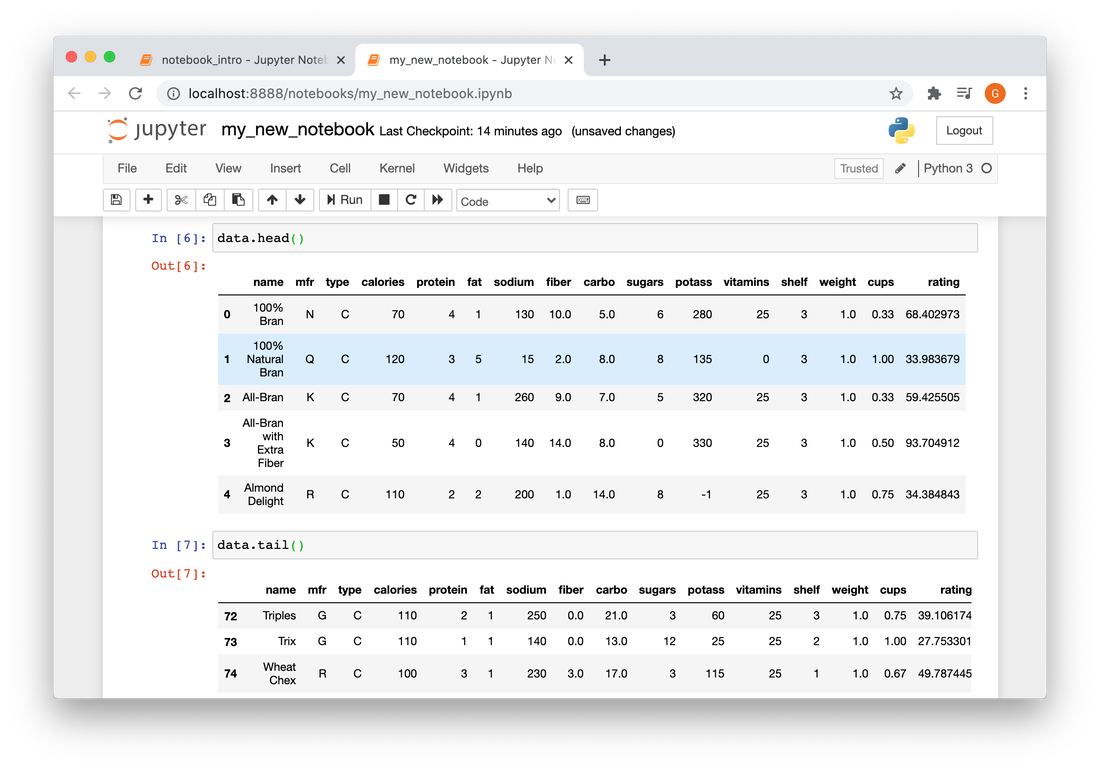
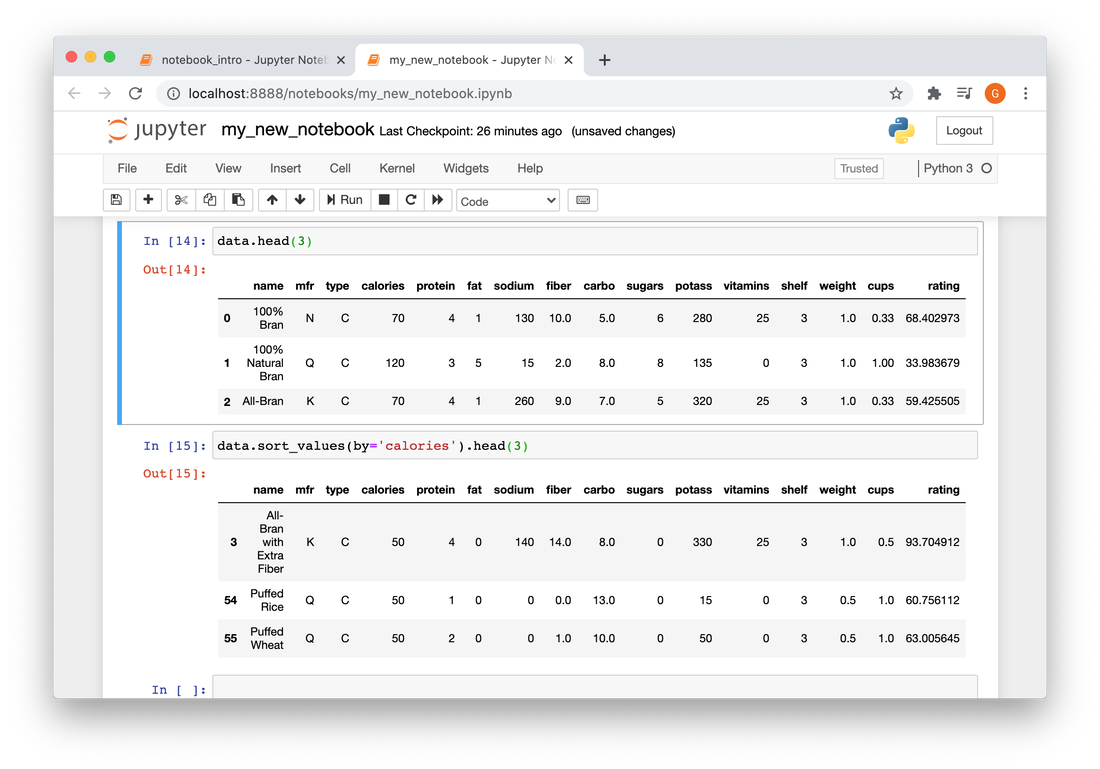
You can now use data.head() or data.tail() to view top and bottom records, you can pass number of rows to head and tail methods
the type of this object is pandas data frame, which is similar to dictionary/JSON
You can now use data.head() or data.tail() to view top and bottom records, you can pass number of rows to head and tail methods
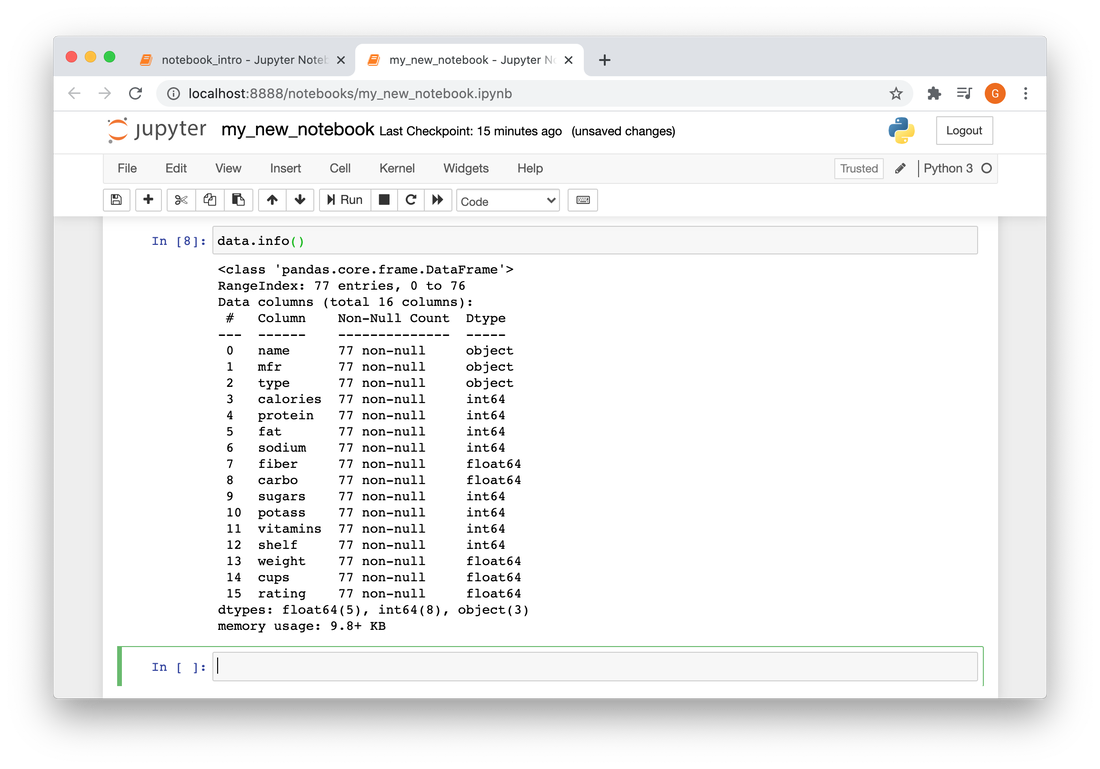
data.info() provides the analysis of the data that pandas has collected,
it will try to guess the data type as part of it
it will try to guess the data type as part of it
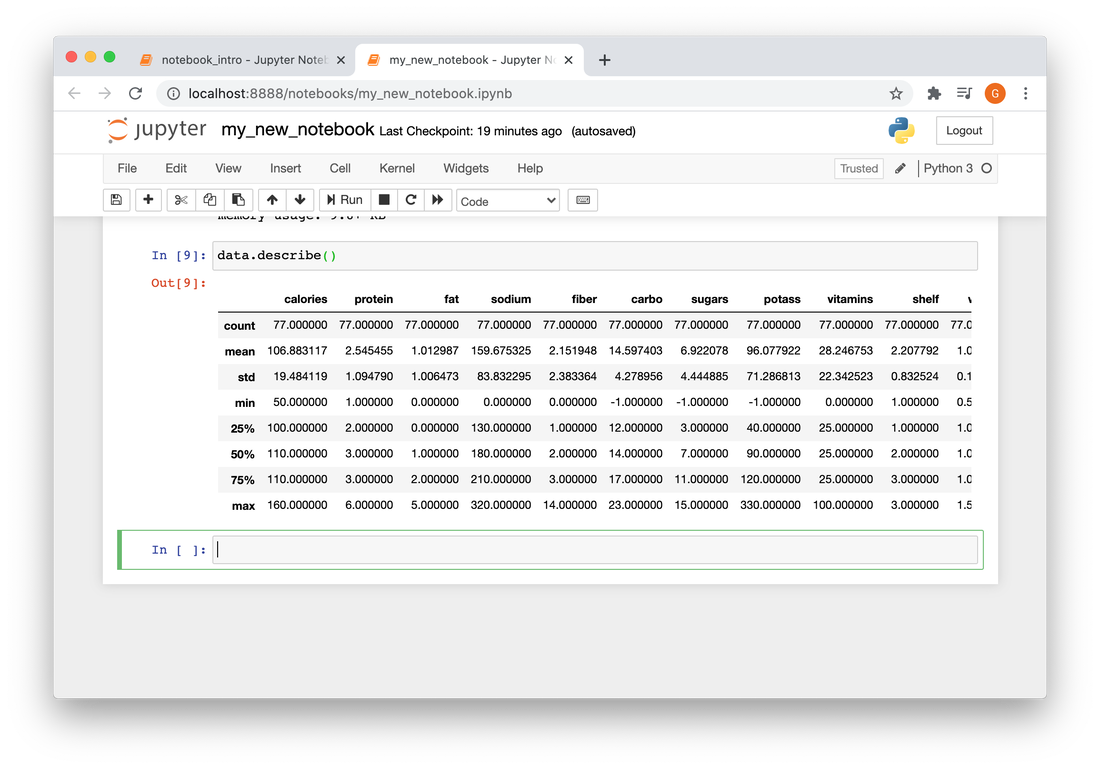
data.describe() gives you standard deviation stats of your data - number of records, mean, standard deviation and quartiles
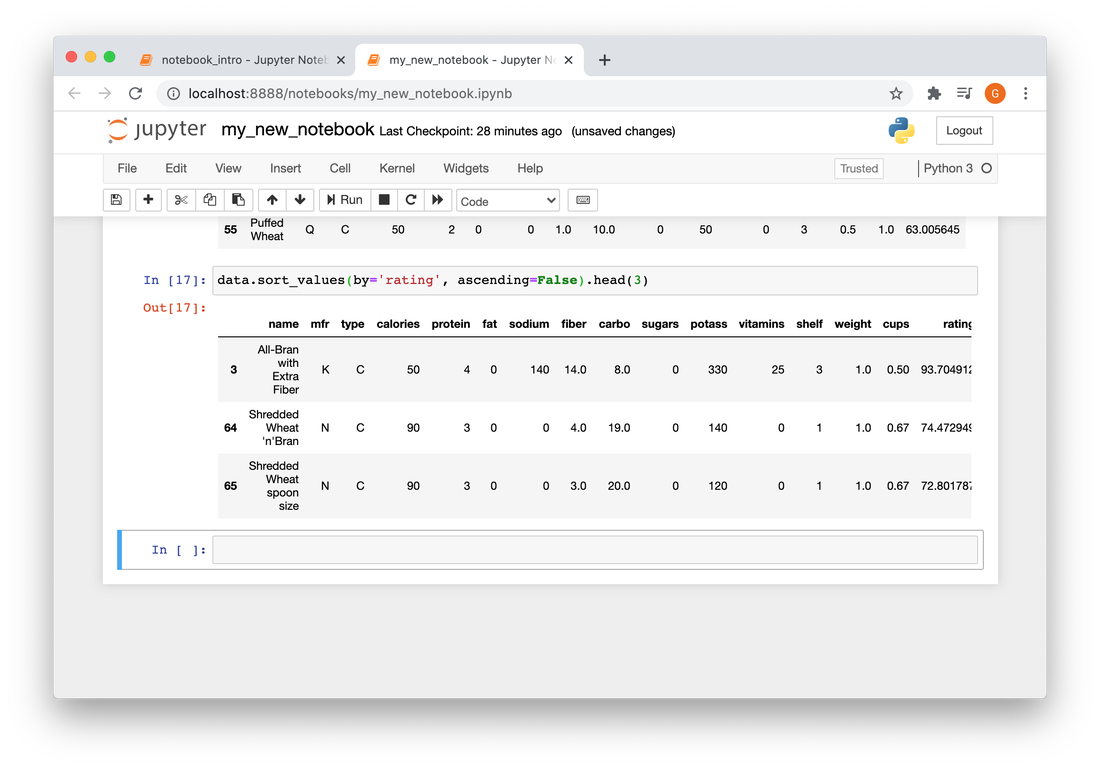
You can sort data:
or in descending order:
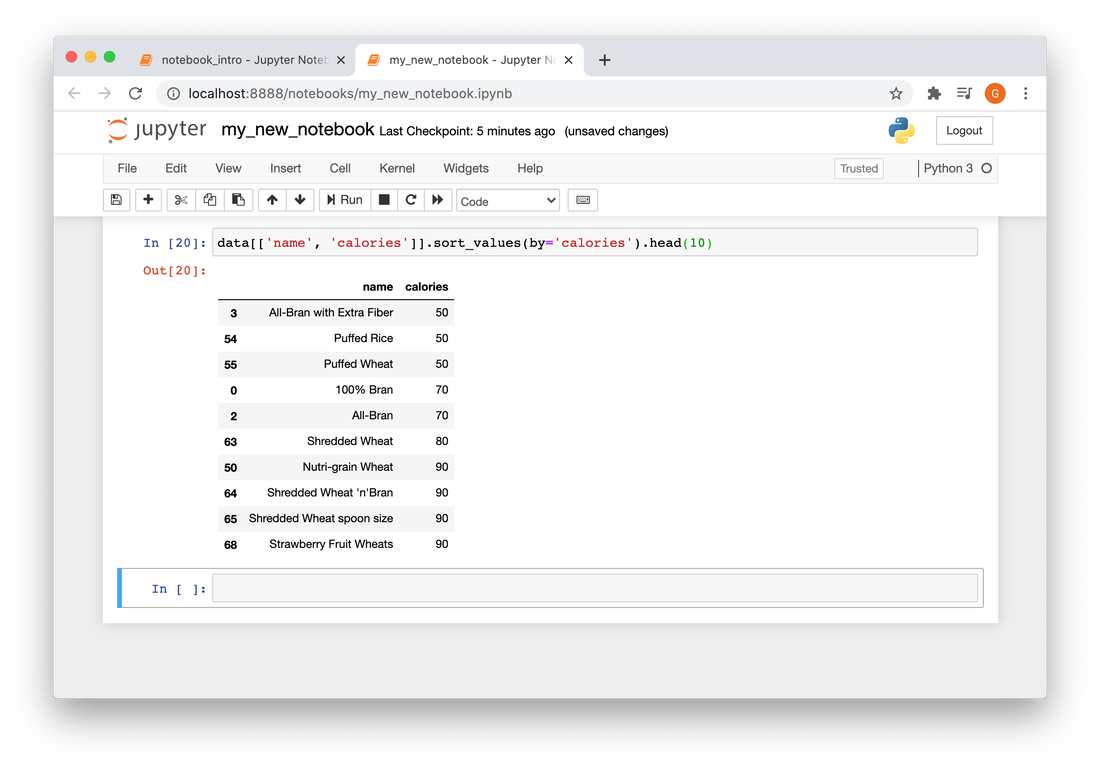
You can subset the data by columns, below is example of top 10 lowest calorie cerials
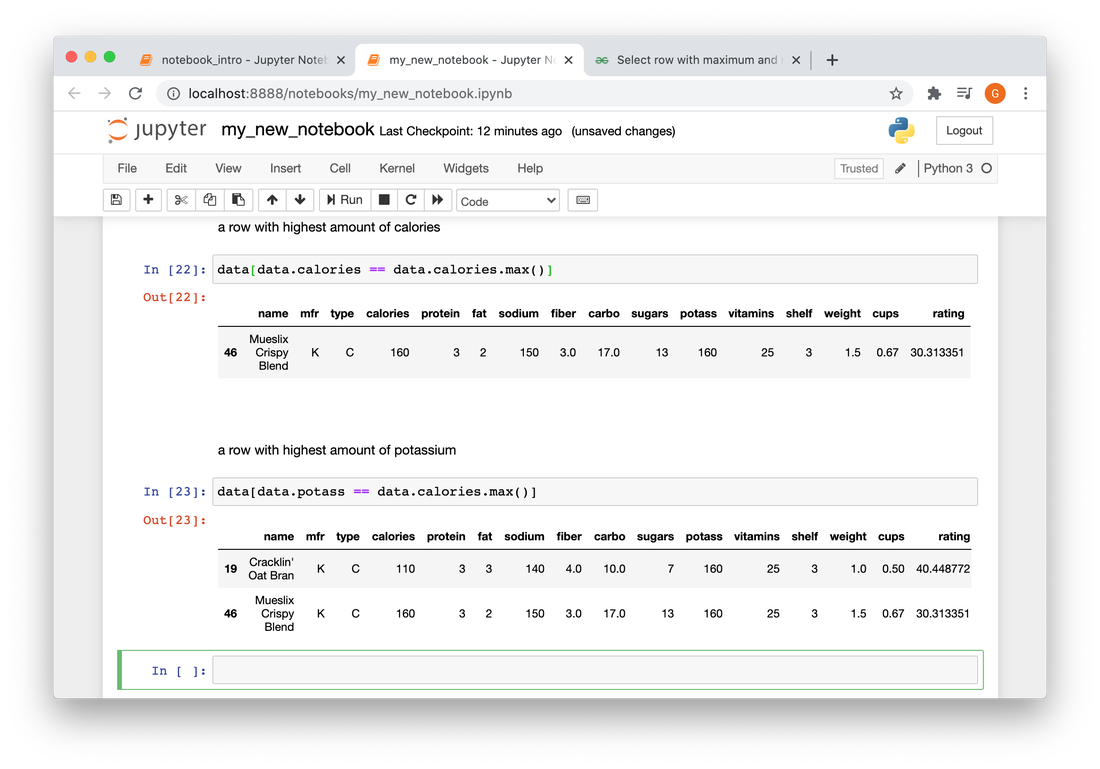
Selecting row with max value:
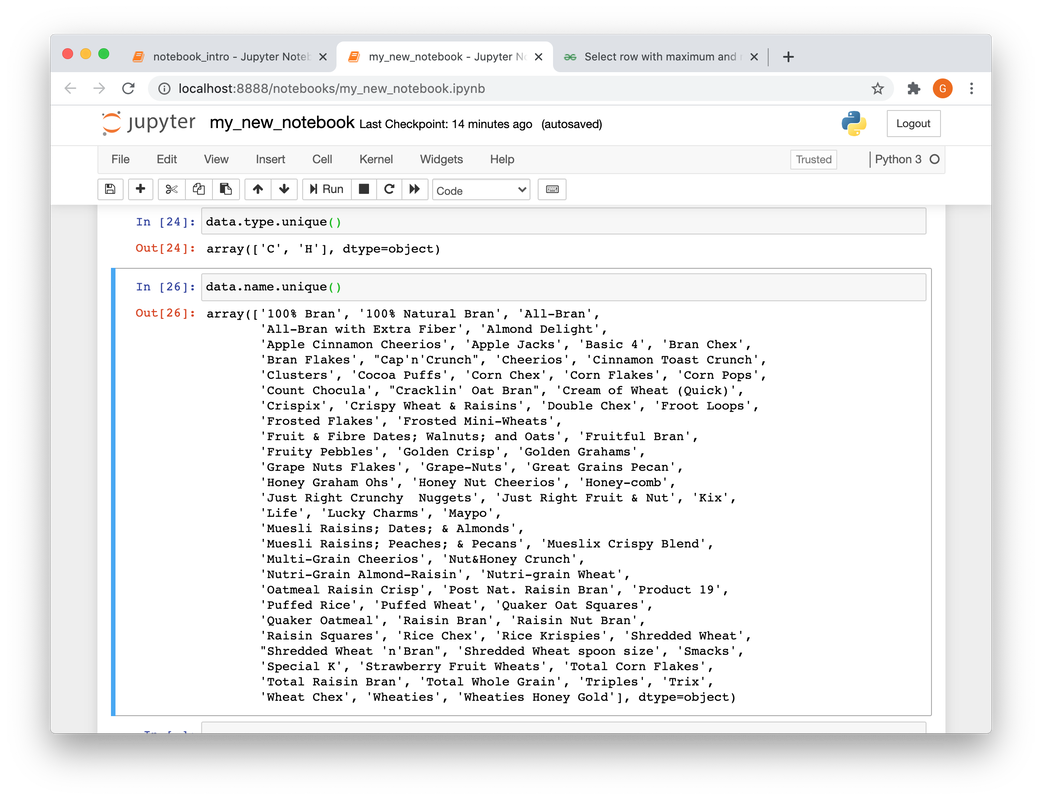
Selecting arrays of unique values:
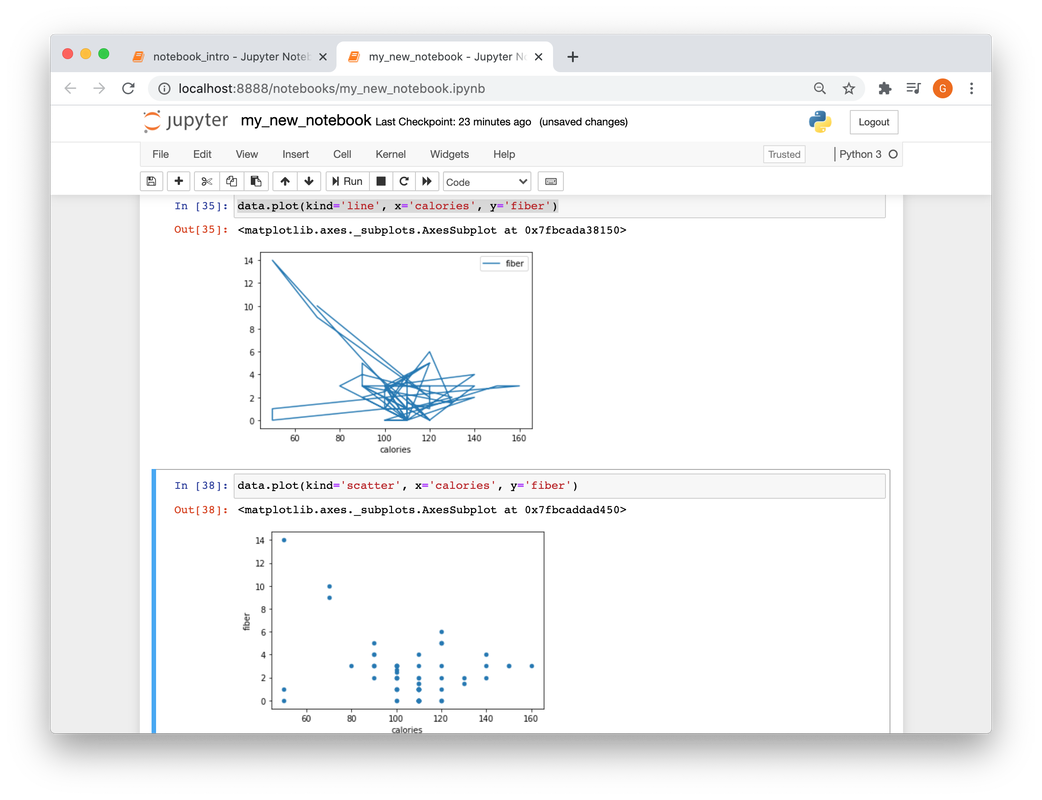
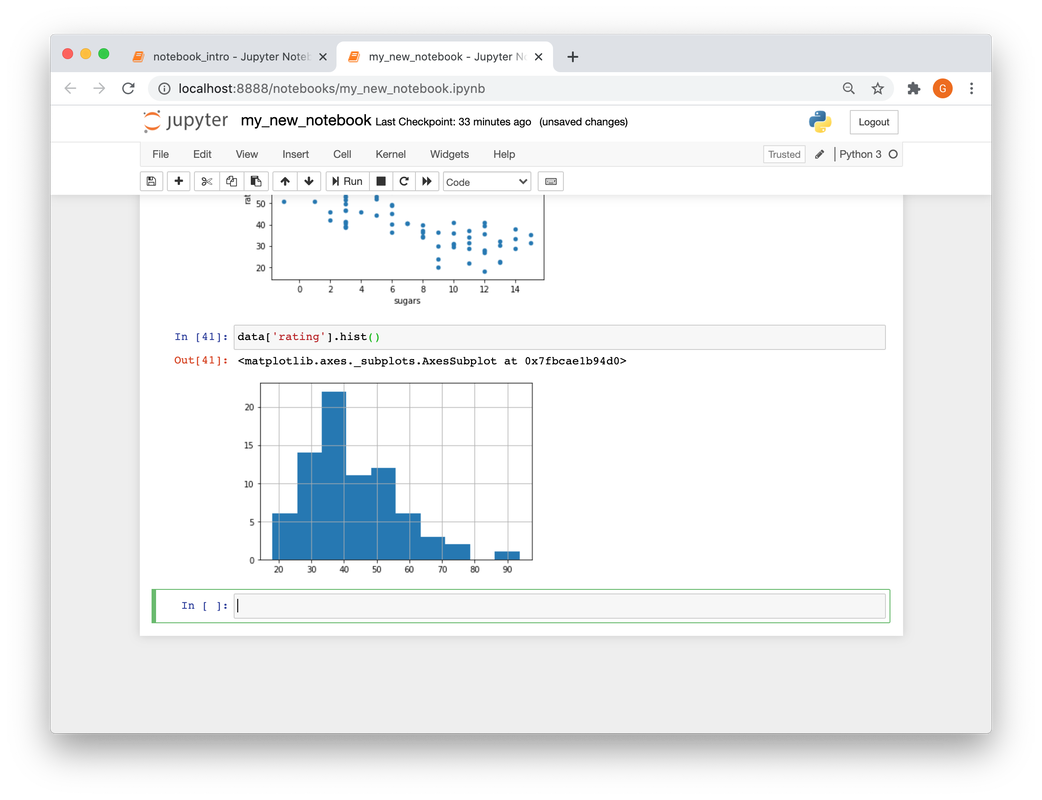
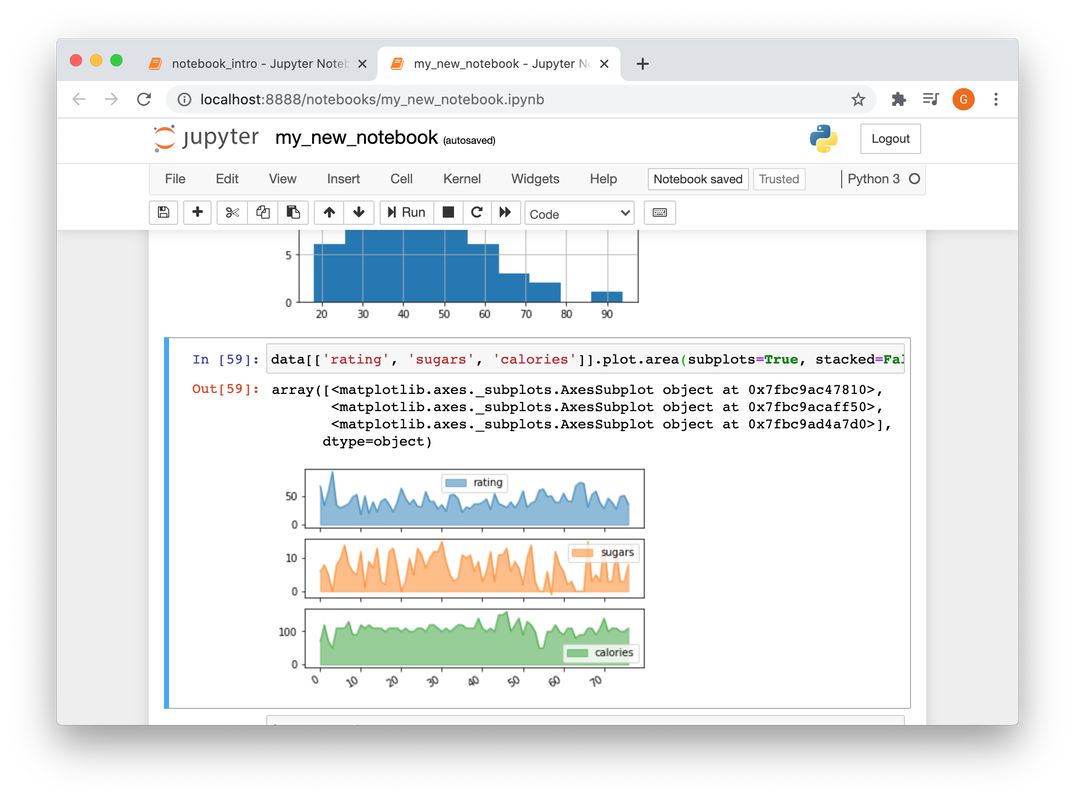
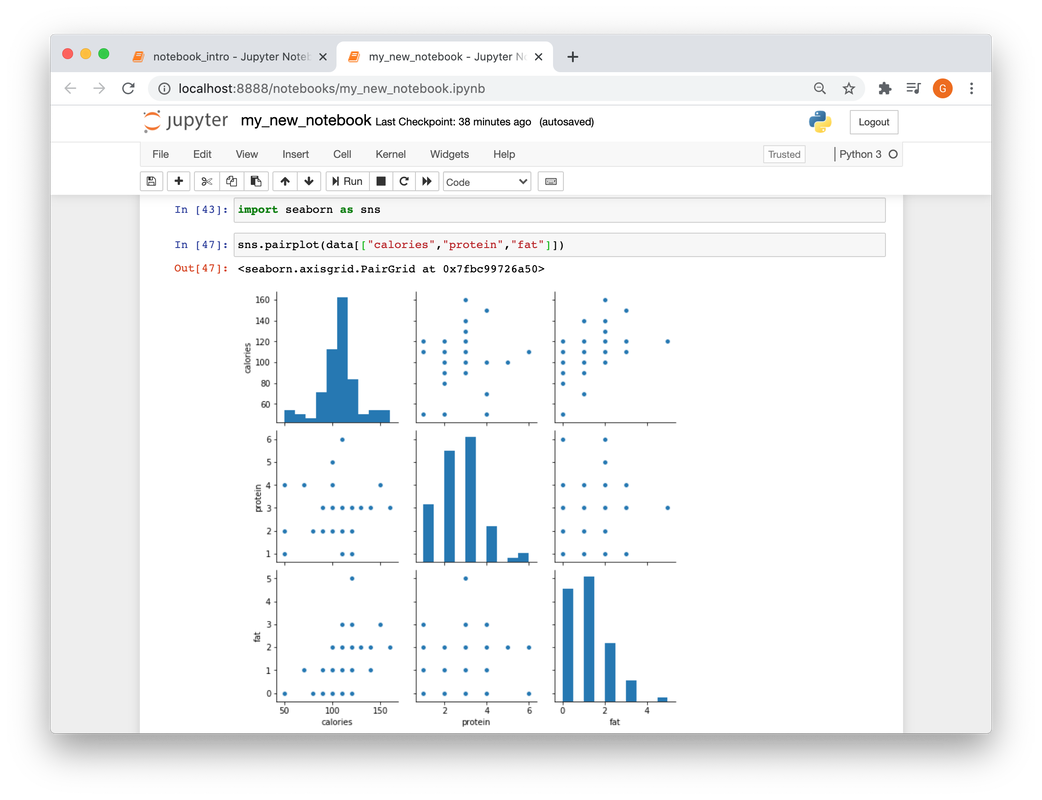
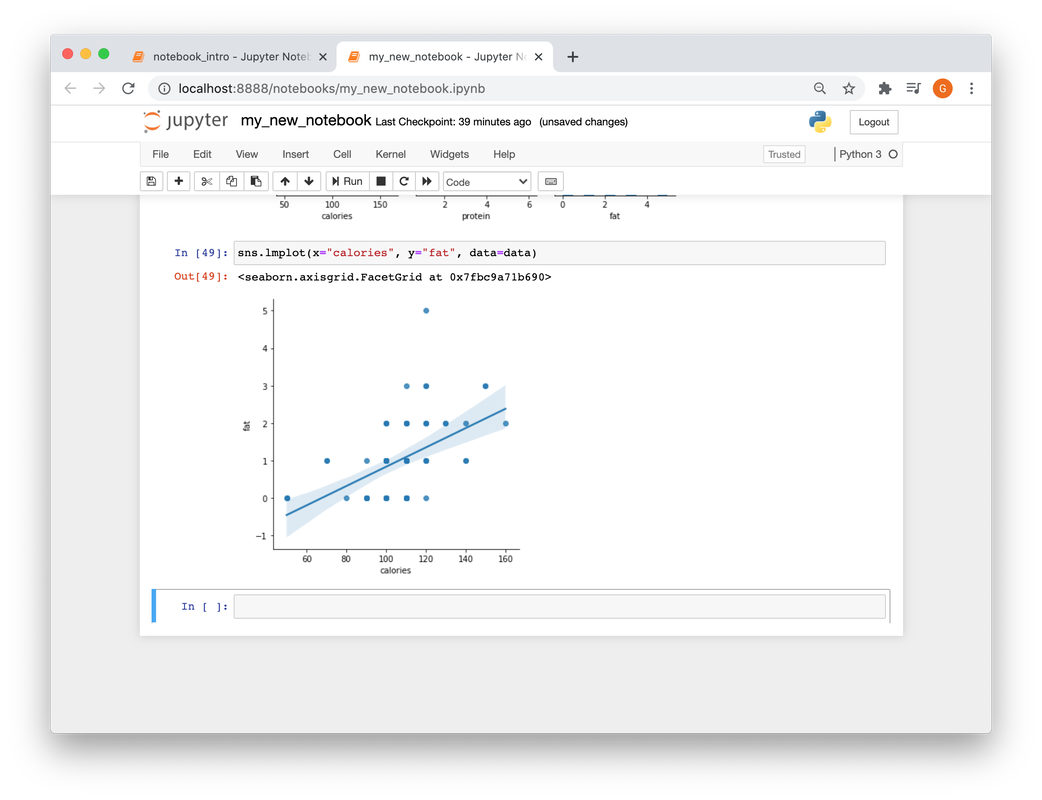
Plotting the data
Add following code in your next python line to be able to plot inside the notebook:
%matplotlib inline
Adding a conda env Kernel
python -m ipykernel install --user --name=base
python -m ipykernel install --user --name=ijupyter
if ipkernel is not working
conda install -c anaconda ipykernel
python -m ipykernel install --user --name=base
python -m ipykernel install --user --name=ijupyter
if ipkernel is not working
conda install -c anaconda ipykernel
