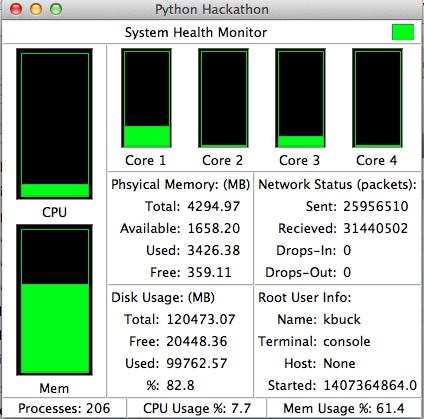
Kevin B.'s Server health monitor project
GIt URL:https://github.com/kbuck210/CS6670-PythonProgramming/tree/Hackathon
Lessons Learned:
1. When working with Tkinter, mainloop() function blocks until base window is closed. Therefore, to continually update the view dynamically, must call after(ms, function) method recursively to call the specified function after the specified interval to update the GUI.
2. Using Frame.grid(…) is effective, but can be difficult to use. However, views cannot mix and match calls to grid() and pack(), as it will result in an infinite loop trying to resolve the spacing
3. Flask is an excellent tool, when it works. Flask does not inherently give any useful information on a failure encountered within the code, so a log handler must be added to the flask app in order to get output on the potential root cause of the problem
4. Google Charts API has many examples online to display simple charts. There are many wrapper classes also available that may make implementation more simple. HTML comments created a few problems not allowing my display to appear, removing them made it work.
5. Exceptions handlers can be used to check for SQL table existence, and creation if not found
6. I subclassed the Frame class in order to generate a custom percentage display, each instance stored it’s size, to be reused in multiple sizes
